SMX Advanced recap: Lies, Damn Lies, and Marketing Statistics
Are your marketing tests giving you valid results? Columnist Mark Traphagen summarizes insights from Vistaprint's Adria Kyne presentation at SMX Advanced.
 At SMX Advanced 2016 in Seattle, Adria Kyne, SEO Manager (North America, Australia, and New Zealand) for Vistaprint, gave a presentation on doing search marketing testing — or any kind of marketing testing — that provides valid results.
Kyne made the point that by not understanding the importance of validity of sample size, we often end up unintentionally lying to ourselves, and we may actually “prove” the opposite of what we think our tests are showing.
Common problems with marketing testing
We need to start with understanding the point of our testing:
- We want to know what is really happening when people visit our site.
- We want to be sure we can use the results to predict likely future behavior.
We also need to understand the basics of hypothesis testing:
- We want to know if the variation we are testing is better, worse or the same as the original.
- We don’t want to see a positive outcome that isn’t really there (a false positive, or Type I error).
- We don’t want to miss a positive outcome (a Type II error).
Problem 1: Using samples that are too small
Common Sad Story #1: Your product page has an average conversion rate (CR) of 2.0 percent. You make a bunch of tweaks to the design, and after 30,000 visitors, your conversion rate is 2.25 percent. You’re a genius! You tell your boss the results and bask in your own success.
Then the end-of-month reports come in, and revenue hasn’t gone up. The Sad Truth: 30,000 visits in this case was not enough to establish the validity of the assumed improvement. Thirty thousand sounds like a lot, but “a large number” by itself is not a good indicator of actual statistical validity.
So how can you know if you have a big enough sample for a valid test?
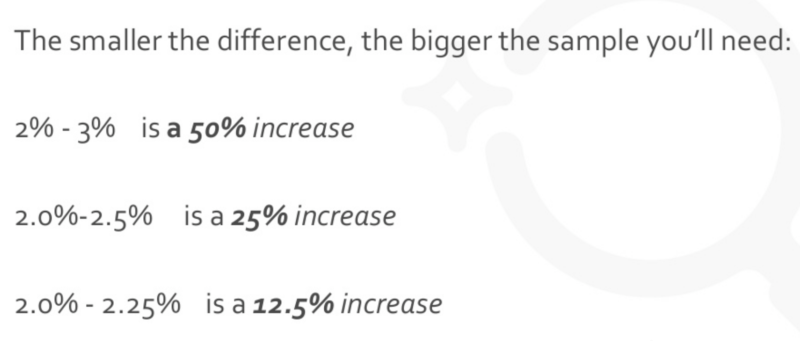
Calculating a valid sample size. If you’re doing a standard A/B hypothesis test, the smaller the conversion increase being tested for, the larger a sample you will need for validity.
Some examples:

So the third example above will need a much larger sample size than the first example in order to establish validity.
Since the math can get complicated, you should look for a good sample size calculator. Unfortunately, their explanations can be hard to understand.
Look for “power analysis for two independent proportions”or something similar in the calculator’s description. “Power analysis” means you are looking for a minimum sample size; “two independent” refers to an A/B test where the variant is shown or not shown to two different sets of users; and “proportions” means rates, such as conversion rates, being compared.
Some common sample size calculator options:
- One-tailed vs. two-tailed test: Use two-tailed (or -sided) to look for results that could be either better or worse. If there is no possible worse situation (e.g., a cancer drug can possibly treat cancer but won’t ever make the cancer worse) then one-tail is okay.
- The significance level is the amount of chance of a false-positive result. Five percent is the most common significance level; if you’re not sure, leave it at this setting.
- Statistical power is the the degree of certainty that you have not missed the sought-after effect. Eighty percent is standard.
Just keep in mind this basic principle: The bigger the increase you’re looking for in conversion rates, the more visits you need in your sample set.
Problem 2: Failing to use significance as a stopping point for a test
Common Sad Story #2: You set up a test, hoping for a modest 0.25-percent increase on a 2.0-percent average conversion rate (CR). After running the test for a bit, your control is still getting a 2.0-percent CR, but the variant is getting a whopping 3.0-percent CR!
Management is eager to roll out the variant and reap the benefits. Just to be sure, you check for significance, and yes, the difference is significant. Success! You roll out the new page and…
… nothing happens.
Why didn’t it work?
A significance calculation assumes that the sample size was fixed in advance. In other words, you had already committed to a sample size before starting the test, instead of waiting until your difference showed as significant, and calling the test complete then.
It also assumes that you have a valid sample. When you ignore these facts and just run until you get a significant result, you’re actually abusing the math.
Here’s what happened. By putting too much weight on a period of high performance of the variable, you’re actually biasing the results. It’s like you’re looking at passing sheep through a curtain that only opens at random times.
If the curtain opens twice and you happen to see a black sheep both times, you might assume that all (or most) of the sheep are black. However, it’s within the significance level that seeing two black sheep in a row could happen, even if in reality white sheep far outnumber the black sheep.
Stopping your test too early vastly increases the chance that you’re getting the five percent that is false (if you’re using that standard setting).
What’s worse is that if you keep running the test and watching for significance, you actually compound the chances of seeing false positives.
This is the classic slippery slope in action. You’re tempted to stop at day five when you hit significance, but running the test all the way to your calculated minimum sample size would show that you had not actually reached significance.

You must pre-commit to a valid sample size, and don’t test for significance before you’ve reached it!
However, management and other stakeholders are often impatient for results. It’s hard for them to understand why you can’t just run with the result once a significant difference shows up. Is there a way to satisfy them?
Sequential A/B testing
Sequential testing solves the problem of repeated significance testing. It allows you to stop the test early if the variant is a clear winner. However, it works with lower conversion rates (under 10 percent).
Designing a sequential experiment
- Determine your sample size N (In this case, N=number of total conversions).
- Measure the success of your control and variant groups.
- Check for stopping points:
- If Variant – Control = 2.25√N, then the Variant wins.
- If Control – Variant = 2.25√N, then the Control wins.
- If Variant + Control = N, then there is NO winner.
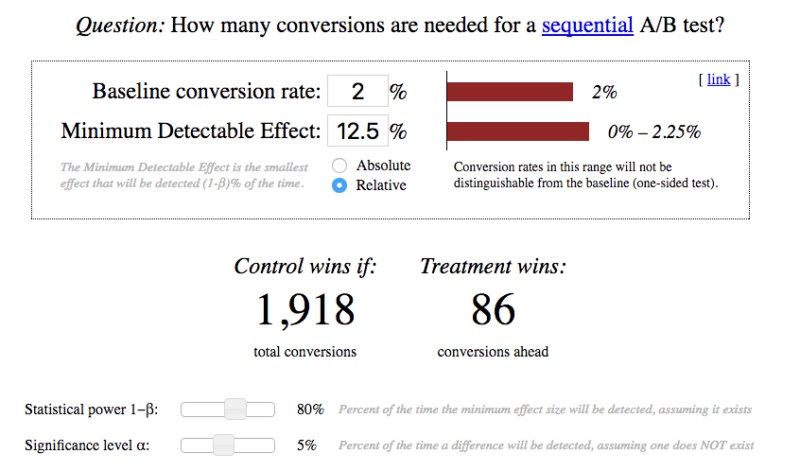
Here’s an example of a sequential sampling calculator (that you can access here):

Deciding between a fixed or sequential test
To determine which test is best for your situation, use this formula: 1.5p + d where p = your baseline conversion rate, and d = the detectable effect you want to see. If the result is less than 36 percent, a sequential test will give you faster results.
For example, if your base CR is 2.0 percent, and the desired detectable effect is 12.5 percent (to a 2.25-percent CR), then 1.5(2.0 percent) + 12.5 percent = 15.5 percent. Since 15.5 percent is less than 36 percent, a sequential test would be your best bet.
However, even armed with all this knowledge, it might still be difficult for management to understand why you can’t provide quick answers. Trying to explain all the math and logic of significance only sounds like you’re deliberately obfuscating. This can be bad for your career!
Bayes’ Theorem to the Rescue!
Bayes’ Theorem (sometimes called Bayes’ Rule) actually allows you to stop your test at any time and still make valid inferences. As a bonus, it’s much easier to understand and explain the results to others.
Here are the chief differences between a Bayesian test and the other types we’ve already reviewed:

So why don’t more marketers use Bayes’ Theorum? We can explain with one word: calculus.
But all is not lost! Just as there were for the other methods, online calculators are available to rescue you from your despair. For example, this calculator shows wins vs. losses data and graphs probability distributions, and it provides a table showing the probability of a result being the best and the spread of conversion rates. To use that calculator, you must determine the probability with which you are comfortable and how much variance you’re willing to accept.
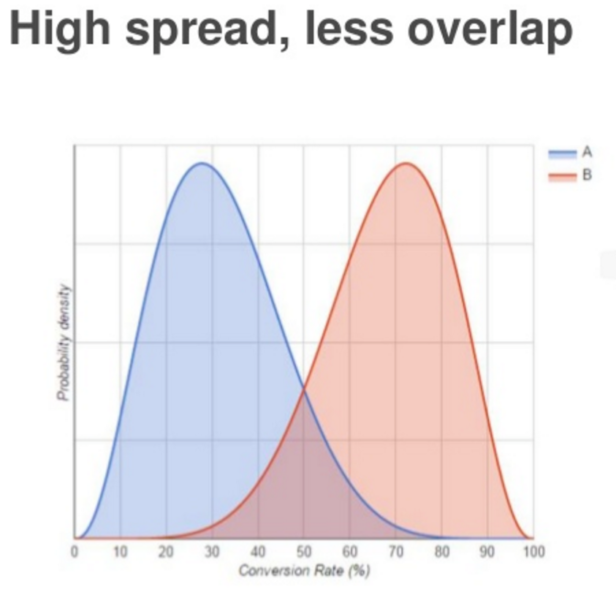
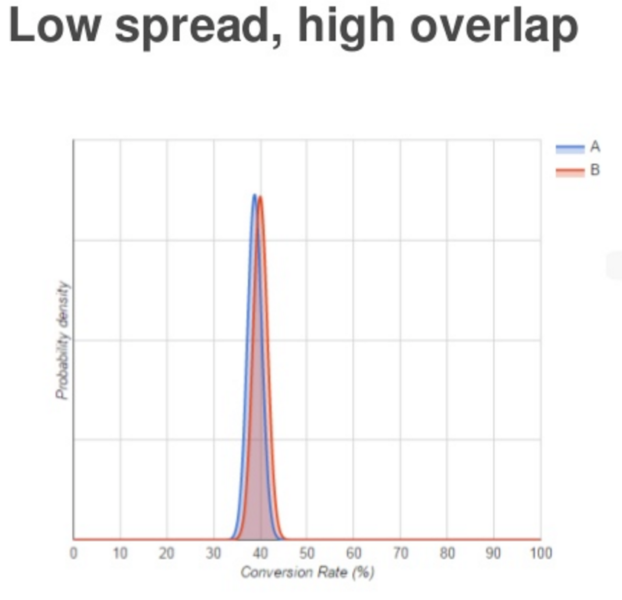
Here are three possible outcomes of the interplay between probability and variance:

High spread, less overlap: In the example above, there is a 96-percent probability that B is better than A, but what’s the real CR? More data is needed.

Low spread, high overlap: Here there is not very much variance in the CR between A and B, but the probability that B is better is only 70 percent.

Less spread, less overlap: Here the variance of CR isn’t as bad, and the separation of the peaks means the CRs are different. There is a 94-percent probability that B is better, but we aren’t certain about the actual CR.
Bayesian testing’s “interesting twist” is that it allows you to start the test with some assumptions, called “priors.” These can include the prior success probability (our belief about the average conversion rate) and how much variance you expect. This Bayesian calculator allows you to set your priors, input your test data and get back the probability that the test variant performs better.
To sum up, the advantages of using the Bayesian method are that you can make inferences from low traffic and low conversions, and you can actually answer, “What’s the probability that the new page will outperform the old one?”
Other potential pitfalls of A/B testing
The problem of illusory lift: This occurs when we are not measuring consistent user groups. If we are not taking into account variables such as time of day, day of week, seasonality and sales promotions, then even statistically valid data may be giving a false positive.
Not accounting for business cycles: Be sure to run your tests for at least one full traffic/conversion cycle. For example, if your customers can typically take up to a week to make a purchase decision, run your test for at least one full week.
Failing to account for user behaviors: It is possible to run your test for too long. In the online world, many visitors may periodically delete their cookies, and that will skew your results if your test is over too long a time.
Summary
Here is a summary of Adria Kyne’s main points:
- Pre-commit to a sample size and/or experimental design and stick with it!
- Fixed sample A/B testing: No peeking before it’s done.
- Sequential A/B testing: built-in peeking
- Bayesian: easier-to-understand results
- Collect samples for a full business cycle, but not too long.
Going deeper
Presenter Adria Kyne provided me with two links to share with those of you who might want to dig deeper into Bayesian testing (for advanced readers only!):
- Bayesian AB Testing (by the developers of the second Bayesian calculator linked above)
- An in-depth discussion of the article above on Hacker News
Opinions expressed in this article are those of the guest author and not necessarily MarTech. Staff authors are listed here.
Related stories


